THANK YOU FOR SUBSCRIBING
Weekly Brief
Be first to read the latest tech news, Industry Leader's Insights, and CIO interviews of medium and large enterprises exclusively from Healthcare Tech Outlook
A featured contribution from Leadership Perspectives: a curated forum reserved for leaders nominated by our subscribers and vetted by our Healthcare Tech Outlook Advisory Board.

Luminis Health
What is the difference between KPI and a Report Card?

Farrukh Kidwai
The Healthcare Industry is looking seriously into reducing Emergency Department (ED) wait times and Length of Stay for inpatients. In recent years, the ED wait time has significantly increased to the point that is painful for the patients, sometimes waiting for 6 to 8 hours before being seen by a provider. Some hospitals are doing well with ED wait times of less than 2 hours (median). What are they doing differently than the others? The report in the link below shows ED wait times by state.
Talk to those hospitals with lower wait times (benchmark) and learn the best practices. Before doing that, let’s review the report card. Are you looking at the report day in and day out without doing anything? The report will not change if there is no Key Performance Indicator (KPI) – Fig #1.
ED Report Card (fig #1)

KPI stands for “Key Performance Indicator.” KPIs are used to monitor the pulse of a process in real-time. For example, imagine a patient being monitored in the ICU. The heart rate, blood pressure, and oxygen level drive the behavior of different organs in real-time. KPIs need to be dynamic, like our car's fuel gauge and speedometer. If we do not act on them, we will be stuck on the roadside without gas and get many speeding tickets.
" We cannot change what occurred in the past, but we can take the information we learned from a past event and apply it to create change in the future "
In contrast, a “report card” is information after an event has occurred. We cannot change what occurred in the past, but we can take the information we learned from a past event and apply it to create change in the future. A report guides us to identify improvement projects, but if the projects do not have a KPI, the report is data without a goal towards improvement.
We can use examples to make this distinction between KPIs and reports clearer. Most U.S. Emergency Departments experience difficulties with their laboratory turnaround time (TAT). Hospitals are generating reports showing what happened in the past, whether over the past day, month, quarter, or year. However, sustained improvement in TAT will not occur unless an appropriate KPI is identified and acted upon.
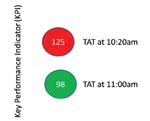
A KPI that can be used in this example would be a visual screen displaying a real-time TAT seen by all ED staff members. Let’s set a target for TAT at 120 minutes. If the TAT goes above the target (“red zone”), the ED Team will act swiftly for improvement (e.g., use of resource management to move staff around), and we will be back under the target quickly (“green zone”). However, if we decline to act, we have a report the following day stating we did not reach our target of 120 minutes (“red zone”). (Fig #2)
ED Key Performance Indicator (fig #2)
 We can use another example outside of healthcare. How would you categorize a student’s semester report card? Is this a KPI or report? It is a report as the students’ grades cannot be changed. However, if we focus on the student’s weekly quiz data (a KPI), we can strategically improve a student’s weak areas for better performance on the following quiz. Continuous improvement in these quizzes will show the results by moving a student’s grades on a report card from a C to an A.
We should identify strong KPIs to drive improvement in our reports. Ideally, we should not use more than one to two KPIs in a process.
The articles from these contributors are based on their personal expertise and viewpoints, and do not necessarily reflect the opinions of their employers or affiliated organizations.